Why You’ve Been Looking at Enbridge’s (TSE:ENB) Dividend Wrong
The internet has accelerated the pace of self-directed investing, and has also made researching companies and buying stocks in Canada much easier than it was 20, 10 or even 5 years ago.
However, this can be a benefit and also a burden when it comes to analyzing stocks, particularly those who pay a dividend and have a more complex business model.
Why a burden?
Well, the availability of information today has made it so “blanket analysis” as I like to call it, or better known as analysis that really doesn’t require much effort at all, is misleading investors.
This is more prominent in dividend paying companies, as most are told to look for specific payout ratios and if they exceed a particular threshold to avoid them at all costs.
Picture perfect “blanket” type analysis
Apply a specific set of instructions to a wide variety of stocks based on very generic valuation methods, and cast aside ones that don’t fit your criteria.
I’m telling you right now, this is likely causing you to overlook some of the best dividend stocks in Canada. And one I’m going to focus on today is Enbridge (TSE:ENB).
One of the primary reasons I’m focusing on Enbridge is it is a stock I often get asked about, or simply told, is an unsafe dividend stock. So I know there are tons of investors out there who simply aren’t looking deeper, or don’t know how to look deeper.
I hope you not only take from this article that Enbridge’s dividend is safe, but that in-depth, thorough analysis is still very much required to succeed long term in the markets.
Why you’ve been looking at Enbridge’s (TSE:ENB) dividend wrong
A quick screen of Enbridge’s dividend will have most income investors running for the hills. Well, the ones who don’t care to put the effort into careful analysis that is.
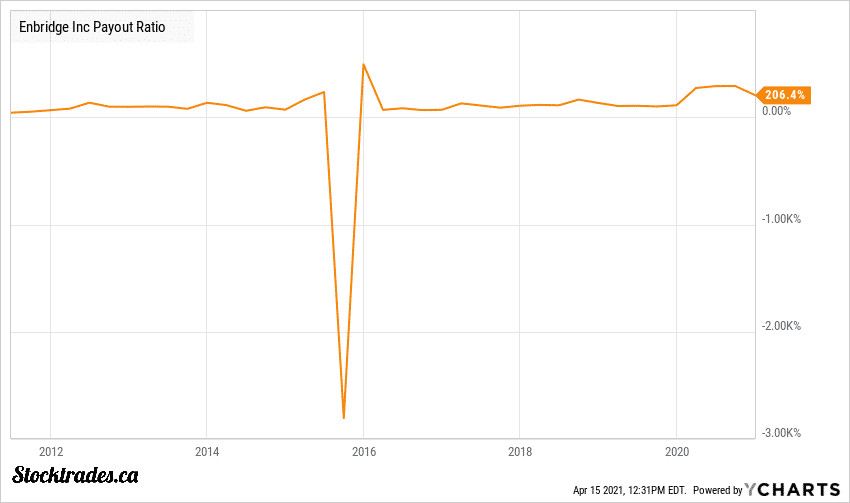
That is because Enbridge’s dividend makes up, at the time of writing, over 200% of earnings.
To someone who doesn’t know how a heavy CAPEX (capital expenditure) and asset intensive company like a pipeline or utility works, they likely don’t know that the payout ratios in terms of earnings is generally useless for a company like Enbridge.
Why you shouldn’t be using the earnings payout ratio to evaluate Enbridge stock
Enbridge is very asset heavy, with over $117 billion in property plant and equipment on its balance sheet. And what I mean by asset heavy is the company must invest significant capital in the form of depreciating assets like PP&E to continue driving revenue.
Without going too much in depth, the purchases of PP&E are depreciated over time.
This means that if Enbridge pays $1 million for a piece of equipment, that $1 million is paid at the time of purchase, but the cost of that equipment is spread out over a particular duration of time.
So, lets say Enbridge chooses to depreciate that asset over 10 years, at a cost of $100,000 a year. This means that for 10 years, Enbridge will book $100,000 in non-cash expenses on its income statement for that equipment.
The piece of equipment hasn’t cost them any actual money in that year, yet it comes off the key number we take from the income statement to judge a company’s dividend, earnings per share.
What you really need to take away from this, is that a company like Enbridge’s earnings per share is not going to be indicative of the actual cash on hand it has to pay the dividend.
If you’re using this payout ratio to analyze a pipeline like Enbridge, you’re doing yourself a disservice.
Why the free cash flow payout ratio isn’t accurate either
When I see an asset heavy company with a lot of non-cash expenses on its income statement like depreciation, amortization and special charges, I head to the cash flow statement.
Why? Well, non-cash expenses like these are added back into the cash flow statement.
Much like its name states, the cash flow statement is designed to show investors the actual flow of money in and out of the company.
So if these non-cash expenses aren’t costing the company any money in the current year, they shouldn’t be reflected in the “cash flow” of the company.
So this is where we calculate the free cash flow payout ratio of a company. Non cash expenses and various other items are added back in to net income to come up with the cash from operations of the company.
We then take the CAPEX (capital expenditures) of the company, which is essentially the money that it has spent to run the business over that time period, and we subtract it from the cash from operations, which gives us the free cash flow of the company.
In most cases, this is the true cash on hand that the company has to pay the dividend
In most situations, free cash flow is going to give you a crystal clear picture on a company’s ability to pay the dividend, and its a payout ratio I use in 90% of my analysis (besides REITs.) But with Enbridge, it’s still a unwarranted red flag.
Why is that? Well, Enbridge is very CAPEX heavy.
And as a result, its free cash flow numbers will likely look as though they cannot cover the dividend. So, we need to go over the final payout ratio, one designed specifically by companies like Enbridge, to show you its dividend is safe.
Why you need to be using distributable cash flow for pipelines
The real safety of Enbridge’s dividend, along with other pipelines like Pembina, TC Energy and Keyera, lies in the distributable cash flow of the company. This is where you’re going to see that Enbridge’s dividend is well covered, and one of the best income options in the country.
However, you won’t find DCF on any financial website. You can’t go to Yahoo Finance and find a company’s DCF payout ratio. Instead you need to actually dig in to the company’s financials, as this is typically calculated by the company themselves.
Distributable cash flow is a complex calculation, one that you really shouldn’t need to educate yourself in unless you’re really looking to dig. And, there can be small tweaks in how each company calculates it.
However if you must know, DCF is often the company’s EBITDA minus its interest, taxes and maintenance CAPEX. At least in Enbridge’s case it is, as most companies will state this inside of their reports.
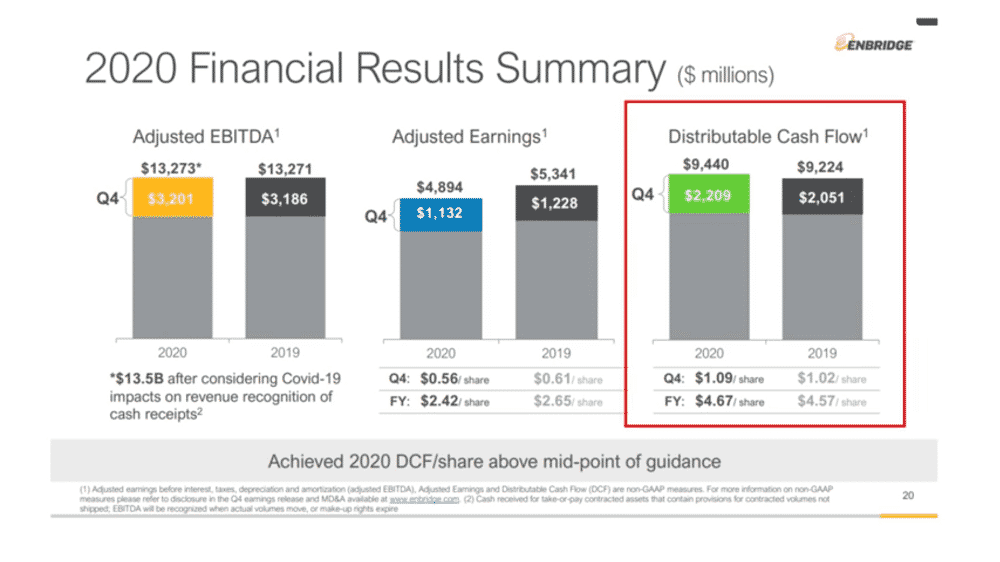
Or, you can simply go to Enbridge’s quarterly report and view their distributable cash flow there:

As we can see, the company has a full year distributable cash flow per share of $4.67, and the company pays an annual dividend of $3.34.
This puts Enbridge’s dividend well below threatening levels, at 71.5% of distributable cash flows. All in all, this dividend is safe.
In fact, Enbridge actually targets payout ratios in this range.
Stop getting tunnel vision when it comes to pre-screening dividend stocks
Being home to thousands of premium members at Stocktrades Premium and over 2.5 million Canadian visitors here at Stocktrades in 2020, the amount of times I’ve been asked whether or not Enbridge’s dividend is safe, or have been outright told that I shouldn’t be highlighting the company because it’s not safe, is alarming.
So, I decided it was about time to produce this post, which is actually a spin off of a video I did a few weeks ago highlighting 4 important payout ratios and when they’re applicable to particular companies.
A pre-screen, and even a more in-depth look at Enbridge in terms of cash flow is going to tell you this dividend is unsafe.
However, when you really dig in and find the applicable payout ratio for the specific company, you’ll see that Enbridge not only has room to pay the dividend, but it’s likely to keep growing in the future.

A very telling sign is the fact that the company’s payout ratio has been above 200% of its earnings for the last decade (see chart above), yet it has continued to pay and raise the dividend without worry. This alone should tell you in your pre-screening that more investigation needs to be done.
Yet, time and time again, investors will overlook one of the best income generating companies in the country for other, “safer” options.
Check out our coverage on some Canadian dividend all-stars for the first week of May 2021!
