VIU vs XEF – Let’s Compare These International ETFs
When considering international equity ETFs for your portfolio, VIU and XEF often come up as top contenders.
These funds offer exposure to developed markets outside North America, but with some key differences.
XEF tracks the MSCI EAFE IMI Index, while VIU follows the FTSE Developed All Cap ex North America Index. This leads to subtle variations in their holdings, performance, and fees.
All of which I’m going to go over in this article.
By the end of this article, you should have a pretty good idea as to which ETF is right for you.
XEF vs VIU – Two premiere international ETFs
XEF and VIU are popular exchange-traded funds (ETFs) for Canadian investors seeking exposure to international developed markets.
Both offer diversification outside North America, but as mentioned, they have key differences in their holdings and tracking indexes.
A quick look at XEF
XEF, or iShares Core MSCI EAFE IMI Index ETF, tracks the MSCI EAFE IMI Index, as you can tell by its name. This fund focuses on Europe, Australasia, and the Far East, excluding North American markets. This is what the “EAFE” stands for.
XEF has attracted $9B~ in assets under management (AUM), making it one of the largest funds in Canada. It holds mostly large-cap stocks from developed markets, providing broad exposure to established economies outside of North America.
The fund doesn’t consider South Korea a developed market, aligning with MSCI’s classification. This results in a slightly different country allocation compared to its counterpart, VIU.
XEF uses a sampling strategy to replicate its index. This can lead to minor tracking errors but generally keeps costs low for investors.
The fund also has a XEF.U version, meaning you can buy and trade the fund in USD.
Overview of VIU
VIU, or Vanguard FTSE Developed All Cap ex North America Index ETF, tracks the FTSE Developed All Cap ex North America Index. It covers a similar geographical area to XEF but with some notable differences.
With $4.5B in AUM, VIU is smaller than XEF but is still a large-scale fund. It holds over 3800 stocks, around 1200 more than XEF, providing extensive diversification across developed markets.
Unlike XEF, VIU includes South Korea as a developed market, allocating about 5% of its portfolio to Korean companies. This difference can impact the fund’s performance and risk profile.
VIU aims to hold all stocks in its index directly. This can reduce tracking error but possibly increase trading costs.
Lets dig into returns
Both XEF and VIU offer exposure to international developed markets, but their performance has differed. Let’s examine the returns of each fund and compare their historical results.
XEF performance
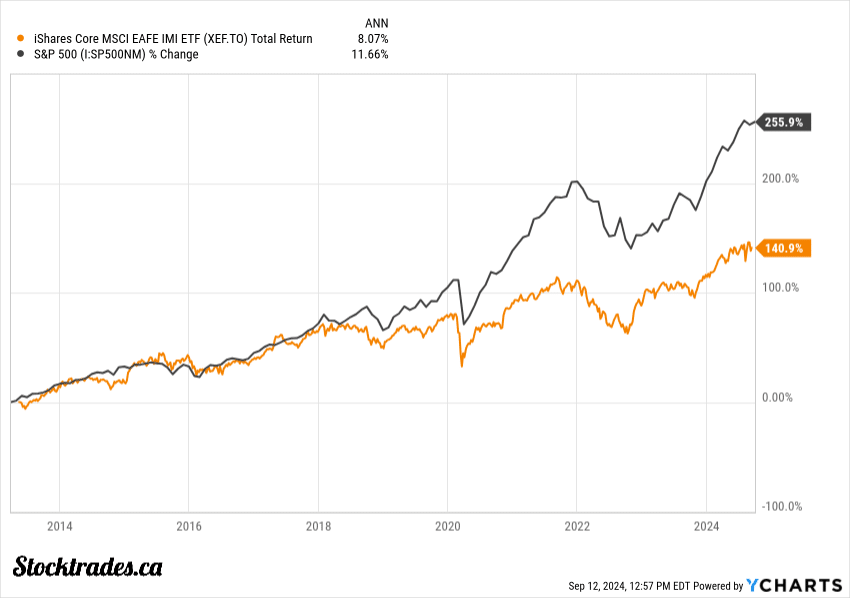
XEF has demonstrated strong performance since its inception. The fund has returned an average of 8%~ annually. Sure, this isn’t anywhere the S&P 500’s 11.66% returns over that same timeframe, however we do have to understand this is an international fund, and the international markets have not kept up the pace relative to the US.

XEF’s diverse portfolio, which includes companies from Japan, the UK, and other developed nations, has contributed to its strong performance. The fund’s low management expense ratio of 0.22% has also helped maximize returns for investors.
Remember that past performance doesn’t guarantee future results. Market conditions and global economic factors can impact XEF’s returns, especially when it comes to developed nations outside of North America.
They tend to have more volatility due to lesser regulatory conditions.
VIU performance
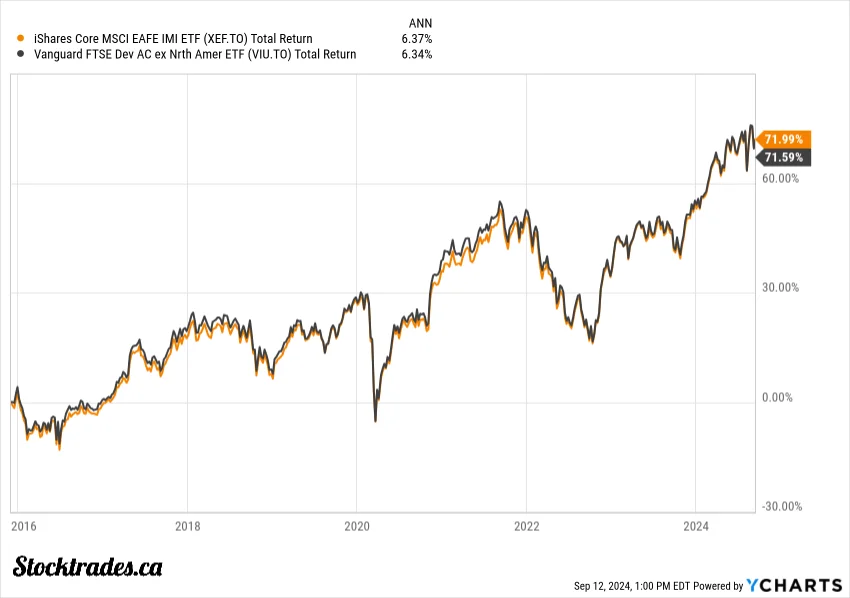
If we look back to the inception of VIU and compare it to XEF, the returns have been nearly identical. VIU has returned around 6.34% annually since 2016 and XEF has returned around 6.37% annually over the same timeframe.

Although XEF has put up strong returns when we speak from its inception, like we did above, it would be unfair to compare the two over a time period where VIU didn’t exist.
Overall, this is the better performing fund
Based on the available data, XEF appears to be the better performing fund between the two, but the result is razor thin, to the point where it’s almost negligible.
In fact, I’d attribute most of XEF’s small outperformance over the years to be a result of a lower management fee.
Speaking of fees, lets dive into those.
Fees
The MER is the primary ongoing cost for ETF investors.
For VIU, the management expense ratio is 0.23%. This means you’ll pay $23 annually for every $10,000 invested.
XEF has a slightly lower MER of 0.22%, costing you $22 per $10,000 invested each year.
Both ETFs are considered low-cost options for international developed market exposure.
Prior to the evolution of ETFs, it would have been an absolute pain to get international exposure at the scale both these funds offer.
The small difference in MER between VIU and XEF is unlikely to significantly impact your returns in the short term. However, over long investment horizons, even a 0.01% difference can compound.
Top holdings
VIU tracks the FTSE Developed All Cap ex North America Index, while XEF follows the MSCI EAFE Investable Market Index.
This leads to some differences in their top holdings. However, the holdings are going to be so close for these two funds that it is almost indistinguishable.
VIU’s largest positions include:
- Nestlé (Switzerland)
- ASML Holding (Netherlands)
- Novo Nordisk (Denmark)
- Samsung Electronics (South Korea)
- AstraZeneca (Sweden)
XEF’s top holdings feature:
- Nestlé (Switzerland)
- ASML Holding (Netherlands)
- Novo Nordisk (Denmark)
- Novartis (Switzerland)
- Roche Holding (Switzerland)
While there’s overlap, XEF excludes South Korean stocks, as MSCI classifies Korea as an emerging market.
Geographical and sector exposure
Both ETFs focus on developed international markets, but their allocations differ:
VIU’s geographical breakdown:
- Japan: 22%
- United Kingdom: 13%
- France: 9%
- Switzerland: 9%
- Germany: 8%
- Australia: 7%
- South Korea: 5%
XEF’s country allocation:
- Japan: 23%
- United Kingdom: 15%
- France: 11%
- Switzerland: 10%
- Germany: 9%
- Australia: 8%
The main difference is VIU’s inclusion of South Korea. Both funds have similar sector exposures, with financials, industrials, and consumer discretionary among the top sectors.
XEF may have slightly higher weightings in European stocks due to its MSCI EAFE focus.
Overall, this is the fund I like best
XEF emerges as the superior choice for Canadian investors seeking international exposure, but it is almost a saw-off.
One of the main decisions for me is its lower management expense ratio. And considering the fact it is a mere 1 basis point (0.01%) lower, you can tell I am grasping at straws to pick the best here.
Both are simply outstanding ETFs when it comes to international exposure.
While VIU includes South Korea in its holdings, XEF’s exclusion aligns with the MSCI index classification. This difference may result in slightly varied performance, but XEF’s overall allocation remains well-balanced across developed markets.
I would not criticize anyone for owning either of these funds. However, I give a very small edge to XEF.
