XBAL vs VBAL – Which Is The Best All In One ETF in 2024?
Are you looking for a hands-off way to diversify your investment portfolio? XBAL and VBAL are two of the most popular exchange-traded funds that offer Canadian investors an easy solution.
These all-in-one funds combine stocks and Canadian bonds in a single package, aiming to provide steady growth and income. They include a diverse basket of North American and international stocks, while also holding a diverse basket of domestic and international bonds.
Both the iShares Core Balanced ETF Portfolio (TSE:XBAL) and the Vanguard Balanced ETF Portfolio (TSE:VBAL) target a 60% equity and 40% fixed income allocation, making them suitable choices for investors seeking moderate risk and returns.
While they share similar goals, there are some critical differences between the two. We’ll go over them in this article.
Benefits of Balanced All In One ETFs
Balanced ETF portfolios combine multiple asset classes, typically equities and fixed income, in a single fund. These all-in-one solutions aim to provide a mix of growth potential and income.
Advantages of balanced ETF portfolios:
- Automatic rebalancing
- Simplified investing process
- Professional management
- Broad diversification
By holding a balanced ETF portfolio, you gain exposure to various asset classes without the need to manage individual investments. This approach can help you maintain a consistent risk profile and potentially smooth out market volatility.
Balanced ETFs often target specific asset allocations, such as 60% equities and 40% fixed income. This predetermined mix helps you stay aligned with your investment goals and risk tolerance.
Comparing XBAL and VBAL
XBAL and VBAL are balanced ETF portfolios offering investors a mix of equities and fixed income. These funds differ in their providers, asset allocations, fees, and historical performance.
iShares vs. Vanguard
XBAL is offered by BlackRock under the iShares brand, while VBAL is provided by Vanguard. Both are reputable investment management firms with a strong presence in the ETF market, so there is virtually no risk there.
iShares tends to focus on a wider range of specialized offerings. Vanguard, on the other hand, is known for its low-cost approach and pioneering role in index investing.
The choice between these providers often comes down to personal preference and specific fund characteristics rather than brand loyalty.
Their objective and asset allocations
Both XBAL and VBAL aim to provide a balanced portfolio with a mix of equities and fixed income.
Both VBAL and XBAL target a 60% equity and 40% fixed income split. Although at the time you are looking at a particular fund, this allocation can seem different. However, once the funds rebalance, they will revert back to their 60/40 allocations.
The most important element in terms of comparing these funds from an allocation standpoint is this:
- XBAL has a higher allocation to Canadian equities (25.42%) compared to VBAL (23.61%)
- XBAL is more heavily weighted towards US equities (27.83%) than VBAL (26.70%)
These slight variations can lead to differing performance and risk profiles over time. Keep in mind, when you look to the total allocations of the portfolio, you may notice higher allocations to Canada and the United States.
This is because it will be taking into account the equity and fixed income portion. When I am speaking on allocations above, I’m only speaking on the equity portion.
VBAL vs XBAL Management fees
When comparing ETFs, fees are a crucial factor as they directly impact your returns. Both XBAL and VBAL have competitive fee structures, but there are differences to consider.
XBAL’s management expense ratio (MER) is 0.20%, while VBAL’s is slightly higher at 0.24%. This means that for every $10,000 invested, you’d pay $20 annually for XBAL and $24 for VBAL.
While this difference may seem small, it can compound over time, especially for larger investment amounts or longer holding periods.
The clear winner here in terms of fees is XBAL. However, fees should be looked at net of performance. So, lets dig into how these two compare in regards to that.
Historical performance and returns
Past performance doesn’t guarantee future results, but performance history can provide insights into how these ETFs have fared in different market conditions.

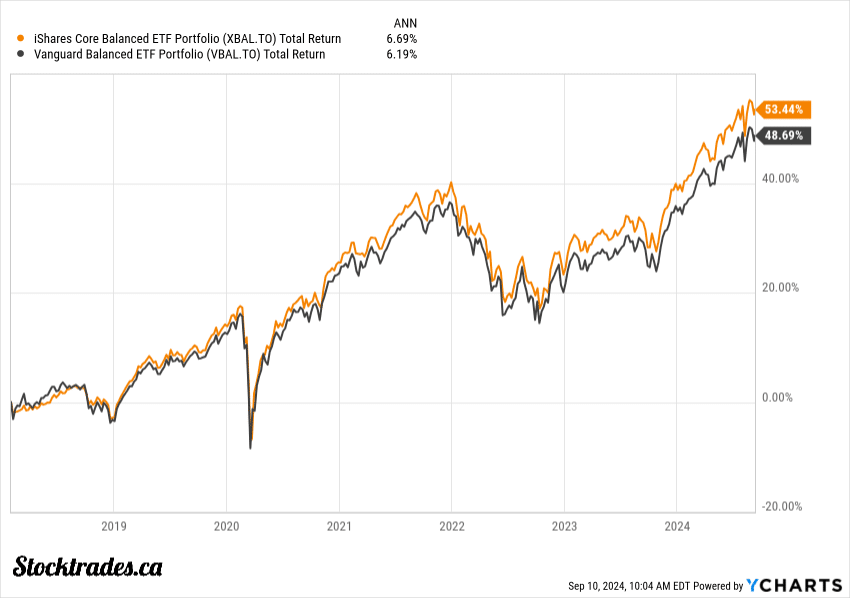
VBAL has delivered a 5.69% annual returns since inception, including 6.19% over the last 5 years.
XBAL’s performance since its inception has been less, coming in at around 5.3% annualized. However, XBAL has been around for a lot longer, since 2007, compared to 2018 for VBAL.
When we look to the last half decade, it has outperformed VBAL, returning 6.6% annually.
It’s important to note that XBAL has experienced a larger maximum drawdown (-28.78%) compared to VBAL (-21.19%), which might indicate slightly higher volatility
Portfolio composition
XBAL and VBAL have distinct approaches to asset allocation and diversification. Their compositions reflect different strategies for balancing growth potential with risk management across various markets and sectors.
Stocks and bond breakdowns
XBAL and VBAL both maintain a 60/40 split between stocks and bonds, providing a balanced approach to investing. This allocation aims to offer growth potential while mitigating risk.
For the most part, these are “funds of funds”, meaning they hold a smaller amount of exchange-traded funds that give them access to thousands of individual holdings.
For example, iShares will hold 5-6 iShares ETFs inside of XBAL that gives it exposure to 10,000+ individual equities and bonds. VBAL will do them same, but with Vanguard funds.
However, if we look into the underlying holdings of the funds they hold, you’ll see the likes of Apple, Microsoft, Nvidia, Amazon, Meta Platforms, Berkshire Hathaway, and Broadcom in some of the top equity holdings.
For Canadian stocks, Royal Bank, Shopify, Enbridge, Canadian Pacific Railway, and Toronto Dominion Bank are some of the more prominent names.
From there, it also owns a large chunk of corporate and government bonds.
Realistically, the individual holdings inside of the portfolio don’t matter all that much when comparing these two funds, because they’re going to own mostly the same underlying stocks and bonds.
The real difference is in the sector and country diversification, which we’ll go over next.
Sector diversification
Both ETFs offer broad sector diversification, but with slight differences in their weightings.
In terms of the equity portion of the portfolio, they’re so close in terms of allocations to particular sectors that it’s not really worth breaking down. Both of these portfolios are well balanced, and aren’t really over weight any particular sector.
The fixed income side of things is where it tends to differ. XBAL owns a bond portfolio that is more intermediate (75% of the portfolio) in terms of overall maturity length, while VBAL is more long-term (30% of portfolio versus 24% of XBAL).
This is likely why you see VBAL yield a bit more than XBAL. The longer we go out in terms of maturity on fixed income, the higher the yields typically are. However, they’re also more prone to pricing fluctuations based on interest rates.
Overall, in terms of sectors, there are small subtle differences, but for the most part the biggest difference is in that fixed income portion.
Geographical allocation
XBAL and VBAL differ somewhat in their geographical distribution of assets.
XBAL has a higher allocation to U.S. equities at 27.83%, compared to VBAL’s 26.70%. VBAL has a slightly higher allocation to Canadian equities.
Both funds include exposure to:
- Canadian Stock Market
- U.S. Stock Market
- Developed International Stock Markets
- Emerging International Stock Markets
XBAL may offer slightly more global diversification, while VBAL might provide a bit more exposure to the Canadian market.
This difference, though small, could impact returns depending on the performance of various global markets.
The Canadian market has lagged as of late, but there is no guarantee it will lag moving forward. If you’re bullish Canadian equities, VBAL does have higher exposure to that market.
Volatility
Both of these ETFs are designed for investors with a low to medium risk tolerance. They aim to balance growth potential with stability through diversification, primarily the inclusion of fixed-income ETFs.
XBAL and VBAL maintain a 60/40 split between equities and fixed income. This allocation helps mitigate risk while providing opportunities for growth, and also provides very similar volatility. There is really no fund here that stands out.
If you’re comfortable with moderate market fluctuations and seek long-term capital appreciation, either fund could align with your risk profile.
Tax considerations
Both XBAL and VBAL are structured as Canadian ETFs, which can offer tax advantages for Canadian investors. Key tax considerations include:
- Foreign withholding taxes: Both funds hold international equities, subject to foreign withholding taxes on dividends, even inside of an RRSP.
- Capital gains distributions: As balanced ETFs, both may distribute capital gains annually, affecting your tax liability.
- Interest income: Both of these funds contain fixed income ETFs, which distribute interest income. This is not the friendliest form of investment income from a tax perspective.
Holding these funds in a tax-sheltered account like a TFSA or RRSP can provide some advantages. However, because they are Canadian domiciled funds that contain US domiciled funds and individual equities, you’ll pay withholding tax on the distributions even inside of an RRSP.
