XEQT vs XGRO – Which iShares ETF is Right For You?
Picking individual stocks is no doubt exciting. The chance to make life-changing returns and retire early is definitely there when it comes to selecting individual companies. However, the chance of being wrong and going broke is also there.
For that reason, many Canadian investors gravitate towards Canadian ETFs, or exchange-traded funds. Why? For the most part, they contain a wide variety of companies, giving the investor broad exposure to the markets for a relatively small fee, especially when we compare them to mutual funds. Canada has a vast array of ETFs small and large, hedged or unhedged ETFs, broadly diverse or industry targeted.
In this article, I’m going to compare two popular iShares ETFs in XEQT vs XGRO.We’ve compared XGRO to VGRO, its Vanguard counterpart in another article, but in this piece, we’re going to stick to the two iShares variants and see how they differ.
XEQT vs XGRO quick comparison table
| XEQT | XGRO | |
|---|---|---|
| AUM: | $922.96M | $1.26B |
| Annual Fee: | $2 per $1000 | $2 per $1000 |
| Allocation | 100% Equities | 80% Equities/20% Fixed Income |
| Total Holdings: | 10,000~ | 20,000~ |
| Top Holding: | Apple | Apple |
| Dividend Yield: | 1.75% | 1.78% |
| 1 Year Returns: | 8.18% | 5.74% |
| Returns Since Inception: | 32.29% (2019) | 24.01% (2007) |
| Max Drawdown: | 29.74% (2020) | 47.37% (2008) |
XEQT vs XGRO – Let’s first look at the iShares Core Growth ETF Portfolio
The iShares Core Growth ETF Portfolio debuted on the Toronto Stock Exchange right before the Financial Crisis in 2008. The fund aims to provide Canadians with long-term capital growth through both the combination of fixed income and equities. As we look through these two ETFs, the core difference between the two will be the fixed income portions.
The fund aims to achieve an 80/20 allocation in terms of equity and fixed income. This means that whenever possible, it wants 80% of the fund to be in stocks and 20% of it in fixed income, such as bonds. It currently has $1.29B in assets under management, making it one of the larger options in Canada.
Why fixed income? Although stocks do have higher returns, fixed income is viewed by many as a strong safety net in times of volatility. And don’t fret, we’ll go over performance in a bit and it will make everything crystal clear.
In terms of holdings, XGRO is gigantic. The fund contains just shy of 20,000 holdings, 9428 of which are stocks and the remainder are bonds. However, the ETF itself doesn’t actually hold that many individual positions. Instead, it holds underlying ETFs, which then hold stocks, to get its exposure.
An example? nearly 40% of XGRO’s assets are in ITOT, which is a total U.S. stock ETF that holds over 3700 US companies. But before we look at the companies in particular, let’s take a look at the fixed income portion of the portfolio.
55% of the fixed income inside of XGRO is comprised of intermediate-length government bonds. These are all but guaranteed to pay out interest to investors and are considered some of the safest bonds in the world. The other 45% is made up primarily of corporate bonds.
These are fixed-income securities issued by companies. The key difference is corporate bonds are, in the grand scheme of things, higher risk. But to compensate for this, they also pay a higher coupon rate. Over 82% of the fixed income inside of this ETF is rated A or better. Meaning there is little risk to these holdings in terms of them not being able to pay coupon rates.
Moving on to the equities, this fund contains a nice mix of both Canadian and US stocks. Case in point, its top 6 holdings have a 50/50 mix of Canadian and US options including Apple, Microsoft, Royal Bank, TD Bank, Amazon, and Shopify.
However with just shy of 10,000 stocks, we can’t expect this fund to hold too much exposure to each company. With just over 2% at the time of writing, Apple is the top holding. In fact, Apple and Microsoft are the only two companies that have a 1.5% weighting or greater in the fund.
From a geographical standpoint, you’re getting a lot of exposure to the Americas with this ETF. But, this is primarily what people want. 76% of its holdings are in North America, with 14% in Europe, and 10% in Asia.
When we look at the management fee (MER) of the ETF, it will cost you around $2 per $1000 invested on an annual basis. If you are just learning how to buy stocks, in terms of a management expense ratio, this certainly isn’t the lowest out there but it is far from expensive considering the broad exposure you get. Many of the other broad-based index funds that have lower management fees will typically be all equity funds and require less rebalancing.
At the time of writing the ETF has a dividend yield of 1.74%. So, if you’re looking for passive income this might not be your best option.
In terms of performance, the fund has performed in line with what investors should expect to return from an 80/20 mix. It has 10 year annualized returns of 8.08%, and with the large bull run of the last 3-4 years, annualized returns bump up to 11.5% over that timeframe.
Next up, let’s look at XEQT and how it compares to XGRO.
The iShares Core Equity ETF (XEQT)
Unlike XGRO, which has been around for quite some time, XEQT is a newer ETF. Its inception date was in late 2019, and had the unfortunate timing of being introduced only 4-5 months prior to the COVID-19 pandemic which caused the markets to crash in March of 2020.
There is one key difference between XGRO and XEQT, and that is the fact that XEQT is a pure equity fund. This means 100% of its allocation is designated towards stocks. And when we get to performance of XEQT, we will compare it to XGRO to show you how these two portfolios differ in overall volatility and risk.
The fund holds 4 core ETFs, including the iShares Core S&P Total US Stock Market ETF (ITOT), the iShares Core S&P/TSX Capped ETF (XIC), the iShares Core MSCI EAFE IMI ETF (XEF), and the iShares Core MSCI Emerging Markets ETF (IEMG). All 4 of these ETFs give XEQT exposure to just over 9600 companies across the globe.
The ETF also has a nice mix of Canadian and US stocks in the top holdings, as the top 6 are Apple, Microsoft, Royal Bank, TD Bank, Amazon, and Shopify. And overall, this fund has around 46% exposure to the United States, 25% to Canada, 5.5% to Japan, and anywhere from 2-3.5% to Switzerland, the United Kingdom, and France.
In terms of management fees, they’re much the same as XGRO, coming in at $2 per $1000 invested. It’s an extremely small price to pay for single click diversity across the entire globe, with emphasized exposure to our markets here in North America.
At the time of writing, the ETF has a distribution yield of around 1.76%. So again, much like XGRO, this isn’t a fund you’re going to buy if you want a passive income stream. Its focus is to provide you broad exposure to the equity markets to benefit from growth in the worldwide economy.
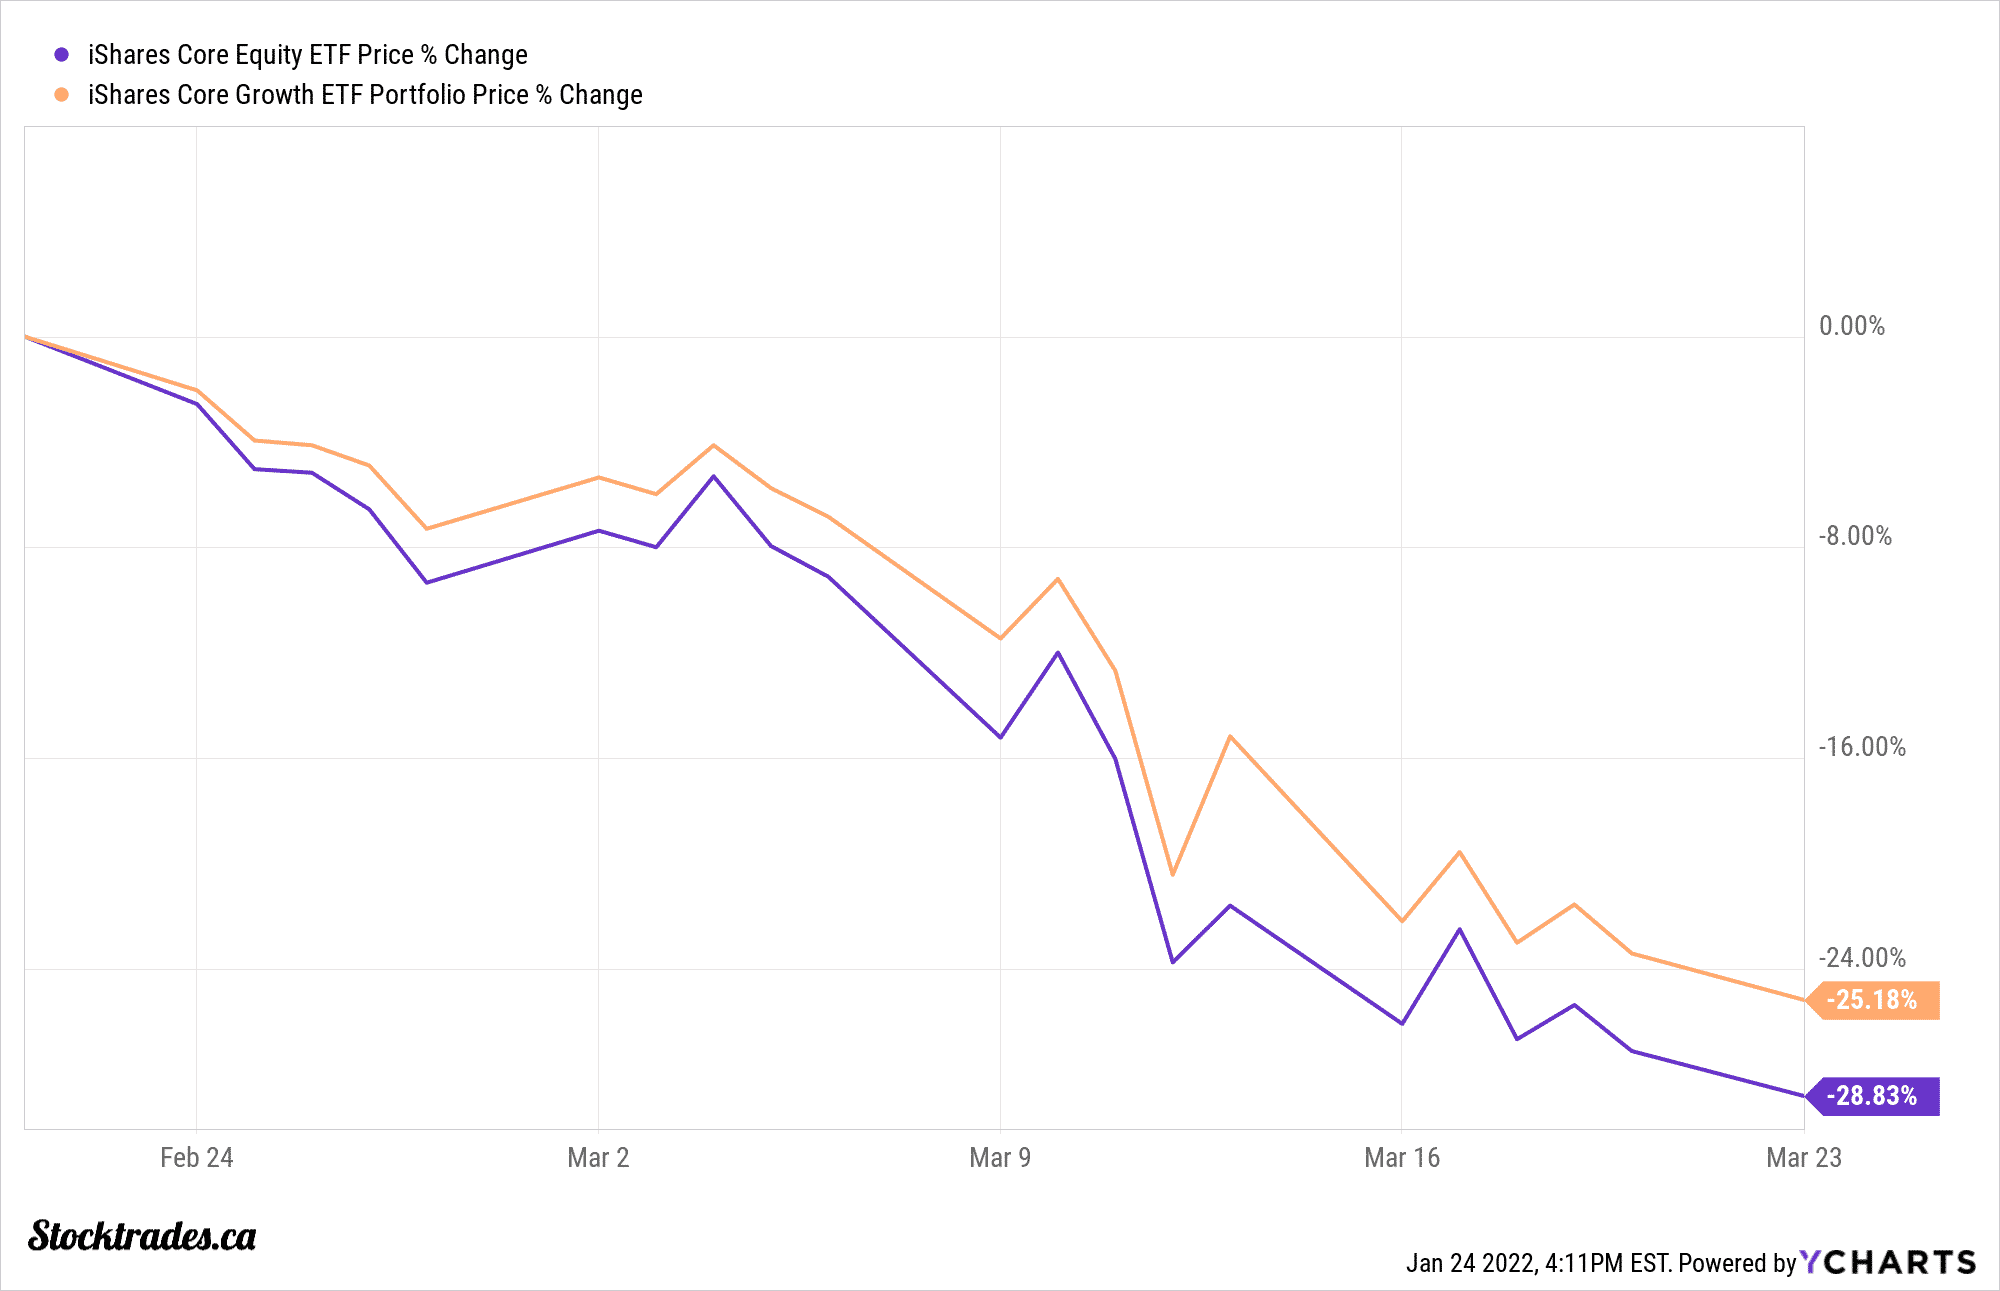
Now, here is where the core differences come into play when it comes to XEQT vs XGRO, and that difference is past performance. Because XGRO contains a portion of fixed income, it is going to be less volatile during market drawdowns, but not have as much potential upside in bull markets. To give you an idea, lets first go over the returns of XEQT vs XGRO during the March 2020 crash.

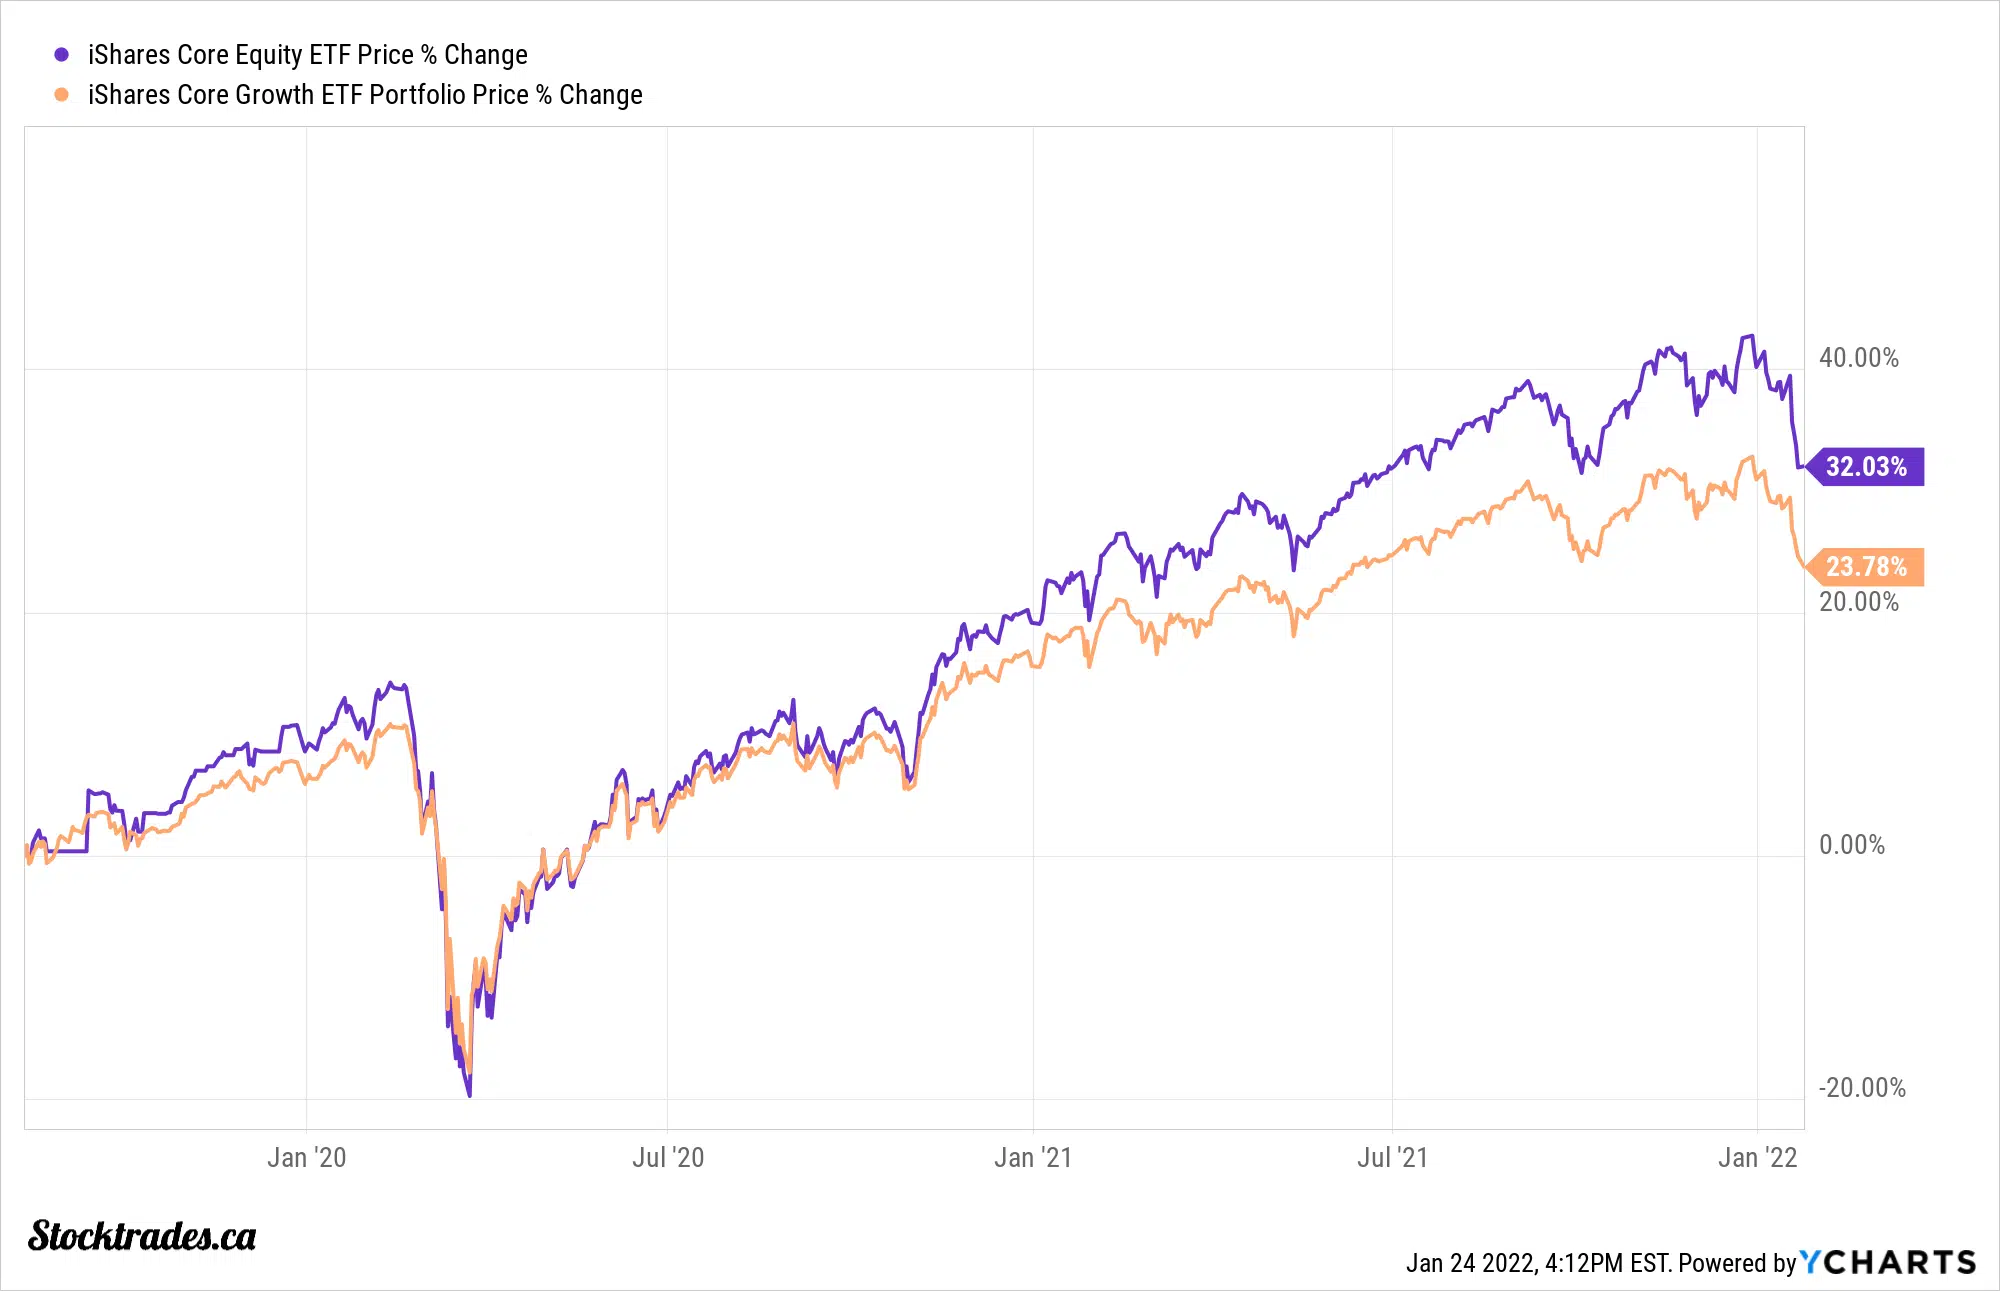
If we look to the image, we can see that XGRO outperformed XEQT by just shy of 4% during the market crash in 2020. And, if we look to the performances of both of them since XEQT’s inception in late 2020 below, we can see that XEQT has outperformed XGRO.

Both of these scenarios make complete sense. During a bear market or crash scenario, an 80/20 portfolio (XGRO) will outperform an all-equity portfolio (XGRO). And during a bull run in stocks, the opposite will occur.
Overall, the decision of which of these ETFs to choose should come down to your risk tolerance
In terms of equity securities, both of these ETFs are practically identical. You’ll gain exposure to the same companies, they have relatively the same dividend, and they both provide one-click diversification across the entire globe.
Where they differ, and what is critical in the decision process of investing in either, is their exposure to fixed income. The fixed income portion of XGRO provides somewhat of a safety net during times of uncertainty, as we’ve highlighted in the charts above. However, during bull runs, you’re ultimately going to be sacrificing overall returns. This is the ultimate cost of fixed income, and to someone with a lower tolerance for risk, it can be a great option.
Both funds have similar expenses, number of holdings, dividend schedule, and are managed by Blackrock Canada.
Pick the one ETF that works for you and roll with it. Another interesting note? Brokerages like Questrade and Qtrade have both of these ETFs available commission free. Meaning you can buy them in your TFSA, RRSP, RESP, or cash account absolutely free!
